Magnetic Resonance Imaging Technologist Hourly Pay in Apple Valley, MN: $46.05 (2026)
Quick Answer:Hourly pay for a magnetic resonance imaging technologist working in Apple Valley, MN runs $46.05 at the median for 2026 — annualizing to $95,768 at a standard 2,080-hour year. Figures projected from BLS OEWS 2025 (SOC 29-2035). Weighted against Apple Valley's regional price level (BEA RPP 98.5, 1% below national), each hour of work buys what $46.75 nationally would. A 24-hour part-time schedule grosses $57,464 per year.
Based on BLS state-level estimates · View source
In Apple Valley, Minnesota, magnetic resonance imaging technologists can expect to earn a median hourly pay of $46.05. This figure falls slightly below the national hourly median of $48.21, indicating a competitive but somewhat constrained local market. For those working part-time, say three days a week, this hourly rate can translate into significant income, especially when considering work in diverse settings such as hospital MRI suites, outpatient imaging centers, and mobile MRI units. Entry-level workers might earn around $33.70 per hour, while top earners can command as much as $60.77 per hour. These figures reflect estimates drawn from annual salary data, showcasing both the potential for a stable income and the advantageous opportunities that exist for experienced professionals in this field.
About the Apple Valley Market
Salary estimated from Minnesota average ($88,000) adjusted for local cost of living.
Magnetic Resonance Imaging Technologist Hourly Wage Breakdown
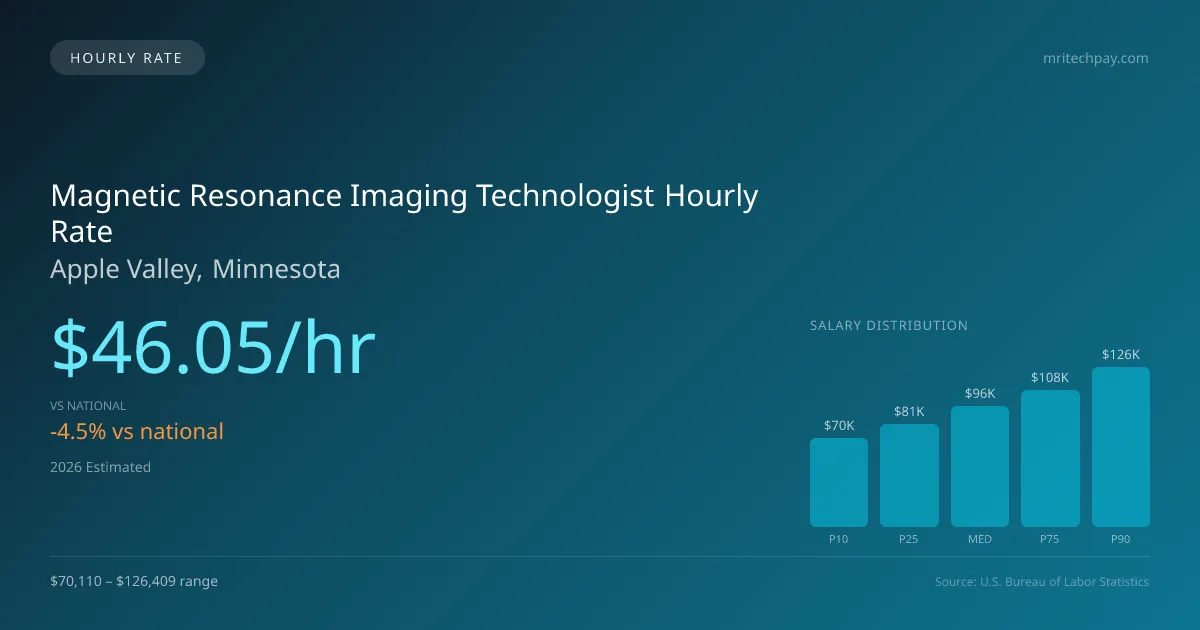
| Percentile | Hourly Rate | Per 8hr Shift |
|---|---|---|
| Entry Level (P10) | $33.70 | $269.63 |
| Lower Range (P25) | $39.10 | $312.82 |
| Median (P50) | $46.05 | $368.36 |
| Upper Range (P75) | $52.16 | $417.26 |
| Top Earners (P90) | $60.77 | $486.16 |
Estimated Annual Income by Work Schedule in Apple Valley
Based on $46.05/hr median hourly rate · 2026 est.
At $46.05/hr, a magnetic resonance imaging technologist working full-time (40 hr/wk) in Apple Valley, MN can expect to earn approximately $95,774 per year (2026 est.). Part-time hygienists working 24 hours per week would earn around $55,254. With a cost-of-living index of 98.50 (below the national average), these earnings stretch further in Apple Valley.
Hourly Rate Calculator
Schedule Comparison in Apple Valley
| Schedule | Weekly | Monthly | Annual |
|---|---|---|---|
| Full-Time (40 hrs) | $1,841.81 | $7,981 | $95,774 |
| Part-Time (24 hrs) | $1,105.08 | $4,789 | $57,464 |
| Per Diem (16 hrs) | $736.72 | $3,192 | $38,310 |
Compare MRI Tech Wages With Similar Roles
| Role | Median Hourly |
|---|---|
| Magnetic Resonance Imaging Technologist (Apple Valley) | $46.05 |
| Radiologic Technologist (National Avg) | $35.27 |
| Nuclear Medicine Technologist (National Avg) | $46.68 |
| Diagnostic Medical Sonographer (National Avg) | $42.41 |
| Radiation Therapist (National Avg) | $48.35 |
Magnetic Resonance Imaging Technologists in Apple Valley, MN earn a median of $95,768 per year (2026 est.), which is 4.50% lower than the national median of $100,283 and 3.00% below the Minnesota state average of $98,730.
Magnetic Resonance Imaging Technologist Hourly Pay vs. Cost of Living
Working 24h/week at $46.05/hr = $57,464/year (purchasing power: $58,339).
Working 40h/week (full-time) = $95,774/year (purchasing power: $97,232).
CoL index: 98.5 (100 = national average). Your dollars stretch further here.
2019 BLS Actual
$33.71/hr
2025 BLS Actual
$43.84/hr
2026 Current Est.
$46.05/hr
2019–2027 Growth
+43.5%
Hourly Rate Trajectory for Magnetic Resonance Imaging Technologists in Apple Valley (2019–2027)
2019–2025: actual BLS OEWS data for this metro area. 2026+: CAGR 5.03% projection.
| Year | Hourly Rate | Status |
|---|---|---|
| 2019 | $33.71/hr | Actual |
| 2020 | $34.29/hr | Actual |
| 2021 | $35.52/hr | Actual |
| 2022 | $36.77/hr | Actual |
| 2023 | $38.45/hr | Actual |
| 2024 | $40.40/hr | Actual |
| 2025 | $43.84/hr | Actual |
| 2026(current) | $46.05/hr | Estimated |
| 2027 | $48.36/hr | Projected |
Based on 7 years of BLS OEWS metropolitan area data, the median hourly rate for magnetic resonance imaging technologists in Apple Valley grew 30.1% from $33.71/hr (2019) to $43.84/hr (2025). At a 5.03% projected growth rate, hourly pay is expected to reach $48.36/hr by 2027. Part-time and per-diem magnetic resonance imaging technologists can use this multi-year trend to benchmark future contract negotiations.
Note: Historical values (2019–2025) are actual BLS OEWS figures for the Apple Valley metropolitan area, sourced from annual Occupational Employment and Wage Statistics surveys. 2026–2026 figures are current estimates, and 2027 values are projections, calculated using a 5.03% CAGR derived from 7-year BLS historical data. Actual salaries may vary based on employer, experience, certifications, and local market conditions.
Working as an Hourly Magnetic Resonance Imaging Technologist in Apple Valley
Earnings for part-time magnetic resonance imaging technologists in Apple Valley who work 24 hours a week would average about $57,889 annually, a solid income compared to many other professions. Per-diem roles offer even greater flexibility and income potential; reporting rates typically range from $55 to $85 per hour, with specialized cardiac MRI positions potentially yielding $75 to $110 per hour. Additionally, travel MRI technologists on contract can make impressive weekly pay between $2,200 and $3,400, with higher rates available for those specializing in cardiac MRI. Various employment types influence pay rates; for instance, those in hospital settings might earn less per hour compared to employees at independent imaging centers, where procurement and revenue models differ. Balancing hourly pay against the benefits of full-time work, such as health insurance, can present a dilemma. Some professionals may accept lower hourly wages in exchange for comprehensive benefits, while others prioritize higher hourly rates without the safety net of employer-provided health coverage. For those negotiating hourly rates, understanding local market trends and demonstrating specialized skills in high-demand areas, like cardiac imaging or advanced MR techniques, can lead to more favorable compensation outcomes.
More salary data for Apple Valley, MN:
Frequently Asked Questions
What is the hourly rate for magnetic resonance imaging technologists in Apple Valley in 2026?
How much do part-time magnetic resonance imaging technologists make in Apple Valley?
Are magnetic resonance imaging technologists in Apple Valley paid hourly or salary?
How much does a full-time magnetic resonance imaging technologist make per year in Apple Valley?
Do magnetic resonance imaging technologists earn more per hour working part-time in Apple Valley?
Related Pages
Compare Salaries
Career Resources
Nearby Cities in Minnesota
Written by Carmen Torres, R.T. (R)(MR)
Career Analyst
Carmen has 10 years of experience as an MRI technologist. She specializes in pediatric imaging at a regional hospital. Carmen contributes to various industry publications.
Methodology & Data Source
Hourly wage figures on this page are 2026 projections based on the Bureau of Labor Statistics Occupational Employment and Wage Statistics (OEWS) survey, May 2026 release. A 5.03% compound annual growth rate (CAGR), derived from 6-year national BLS wage trends, was applied to estimate current 2026 hourly rates for magnetic resonance imaging technologists in Apple Valley. Part-time and full-time income estimates assume consistent weekly hours and do not account for overtime, benefits, or seasonal variation.
Data Sources & Methodology
Salary data for Apple Valley is estimated from official BLS state-level occupational wage data (2025), adjusted for regional cost-of-living differences using BEA RPP (Regional Price Parities).
2026 figures are projected from 2025 BLS data using a compound annual growth rate (CAGR) of 5.03%, derived from historical BLS wage trends for magnetic resonance imaging technologists (SOC 29-2035).
Compiled and verified by Carmen Torres, R.T. (R)(MR), a licensed magnetic resonance imaging technologist with 10+ years of clinical experience. · View source data at BLS.gov